作者:老余捞鱼
原创不易,转载请标明出处及原作者。
写在前面的话:本文是探讨NLP情感分析与机器学习如何完美融合的第二篇,在本篇中我们将接着介绍通过抓取最新的谷歌新闻和使用Yahoo Finance API获取的财务数据,为投资者提供即时的市场洞察和财务信息,从而更准确地评估股票的价值。
在上一篇中,我们介绍了以NVDA 股票为例的周标量情绪评分和以AMZN 股票为例的周矢量情绪评分。现在我们将进一步的深入探讨关于矢量情绪评分的技术落地。
上篇地址:科技股预测新利器:NLP情绪分析与机器学习的完美融合(一)
一、抓取近期谷歌新闻获得的矢量情绪评分
在本节中,我们将学习如何抓取给定股票的近期谷歌新闻。目标是从解析的新闻文章中衡量股票情绪得分,为了大家更好理解,我们还是以AMZN 股票为例。
步骤 1:基本导入和安装
!pip install newspaper3k
!pip install GoogleNews
!pip install nltk
!pip install --upgrade lxml_html_clean

import pandas as pd
import matplotlib.pyplot as plt
import datetime as dt
import nltk
from nltk.sentiment.vader import SentimentIntensityAnalyzer
from GoogleNews import GoogleNews
from newspaper import Article
from newspaper import Config
from wordcloud import WordCloud, STOPWORDS

nltk.download('vader_lexicon') #required for Sentiment Analysis
True
步骤 2:搜索AMZN 股票的谷歌新闻
now = dt.date.today()
now = now.strftime('%m-%d-%Y')
yesterday = dt.date.today() - dt.timedelta(days = 1)
yesterday = yesterday.strftime('%m-%d-%Y')

nltk.download('punkt')
user_agent = 'Mozilla/5.0 (Macintosh; Intel Mac OS X 10.15; rv:78.0) Gecko/20100101 Firefox/78.0'
config = Config()
config.browser_user_agent = user_agent
config.request_timeout = 10

# save the company name in a variable
company_name = input("Please provide the name of the Company or a Ticker: ")
#As long as the company name is valid, not empty...
if company_name != '':
    print(f'Searching for and analyzing {company_name}, Please be patient, it might take a while...')

    #Extract News with Google News
    googlenews = GoogleNews(start=yesterday,end=now)
    googlenews.search(company_name)
    result = googlenews.result()
    #store the results
    df = pd.DataFrame(result)
    print(df)

Please provide the name of the Company or a Ticker:  AMZN
Searching for and analyzing AMZN, Please be patient, it might take a while...
                                               title                  media  \
0  Exclusive survey: In response to Amazon’s RTO ...           Fast Company
1  Amazon workers go on strike in US ahead of Chr...          Yahoo Finance
2  Amazon hit by Teamsters strikes during holiday...    The Washington Post
3  Will Amazon Shatter the $3 Trillion Ceiling by...  smartphonemagazine.nl
4  Teamsters union launches historic nationwide s...           Fox Business
5  Amazon workers plan ‘largest strike’ against c...         Retail Systems
6  Brigade Enterprises Could See Rental Gains As ...            NDTV Profit
7  Amazon workers to strike at multiple US wareho...                Reuters
8  Amazon exits India's Shoppers Stop by selling ...          Fibre2Fashion
9  Teamsters say Amazon workers will strike at mu...                    MSN

            date                   datetime  \
0  9 minutes ago 2024-12-19 12:10:44.812096
1  9 minutes ago 2024-12-19 12:10:44.828096
2  3 minutes ago 2024-12-19 12:16:44.831096
3  3 minutes ago 2024-12-19 12:16:44.833096
4  9 minutes ago 2024-12-19 12:10:44.835096
5  4 minutes ago 2024-12-19 12:15:44.837096
6  8 minutes ago 2024-12-19 12:11:44.840096
7  9 minutes ago 2024-12-19 12:10:44.842096
8  9 minutes ago 2024-12-19 12:10:44.844096
9  9 minutes ago 2024-12-19 12:10:44.846096

                                                desc  \
0  Amazon's RTO mandate takes effect in January. ...
1  Warehouse workers in cities including New York...
2  The coordinated strikes ahead of Christmas are...
3  Amazon, the global e-commerce giant, is on a t...
4  Amazon workers associated with the Teamsters u...
5  Thousands of Amazon workers are set to walk of...
6  Brigade Enterprises Ltd. is yet to confirm Ama...
7  Dec 18 (Reuters) - Thousands of Amazon.com (AM...
8  US-based Amazon yesterday exited Mumbai-headqu...
9  The International Brotherhood of Teamsters sai...

                                                link  \
0  https://www.fastcompany.com/91248618/exclusive...
1  https://finance.yahoo.com/news/amazon-workers-...
2  https://www.washingtonpost.com/business/2024/1...
3  https://smartphonemagazine.nl/en/2024/12/19/wi...
4  https://www.foxbusiness.com/economy/teamsters-...
5  https://retail-systems.com/rs/Amazon_Workers_P...
6  https://www.ndtvprofit.com/business/brigade-en...
7  https://www.reuters.com/technology/amazon-work...
8  https://www.fibre2fashion.com/news/e-commerce-...
9  https://www.msn.com/en-us/money/companies/team...

                                                 img
0  data:image/gif;base64,R0lGODlhAQABAIAAAP//////...
1  data:image/gif;base64,R0lGODlhAQABAIAAAP//////...
2  data:image/gif;base64,R0lGODlhAQABAIAAAP//////...
3  data:image/gif;base64,R0lGODlhAQABAIAAAP//////...
4  data:image/gif;base64,R0lGODlhAQABAIAAAP//////...
5  data:image/gif;base64,R0lGODlhAQABAIAAAP//////...
6  data:image/gif;base64,R0lGODlhAQABAIAAAP//////...
7  data:image/gif;base64,R0lGODlhAQABAIAAAP//////...
8  data:image/gif;base64,R0lGODlhAQABAIAAAP//////...
9  data:image/gif;base64,R0lGODlhAQABAIAAAP//////...
步骤 3:解析文章并执行 NLP
try:
    list =[] #creating an empty list
    for i in df.index:
        dict = {} #creating an empty dictionary to append an article in every single iteration
        article = Article(df['link'][i],config=config) #providing the link
        try:
          article.download() #downloading the article
          article.parse() #parsing the article
          article.nlp() #performing natural language processing (nlp)
        except:
           pass
        #storing results in our empty dictionary
        dict['Date']=df['date'][i]
        dict['Media']=df['media'][i]
        dict['Title']=article.title
        dict['Article']=article.text
        dict['Summary']=article.summary
        dict['Key_words']=article.keywords
        list.append(dict)
    check_empty = not any(list)
    # print(check_empty)
    if check_empty == False:
      news_df=pd.DataFrame(list) #creating dataframe
      print(news_df)

except Exception as e:
    #exception handling
    print("exception occurred:" + str(e))
    print('Looks like, there is some error in retrieving the data, Please try again or try with a different ticker.' )

 Date                  Media  \
0  9 minutes ago           Fast Company
1  9 minutes ago          Yahoo Finance
2  3 minutes ago    The Washington Post
3  3 minutes ago  smartphonemagazine.nl
4  9 minutes ago           Fox Business
5  4 minutes ago         Retail Systems
6  8 minutes ago            NDTV Profit
7  9 minutes ago                Reuters
8  9 minutes ago          Fibre2Fashion
9  9 minutes ago                    MSN

                                               Title  \
0
1
2
3                                Smartphone Magazine
4  Teamsters union launches historic nationwide s...
5
6
7
8
9                                                MSN

                                             Article  \
0
1
2
3  Accessing precise market data can sometimes be...
4  Thousands of Amazon workers nationwide organiz...
5
6
7
8
9

                                             Summary  \
0
1
2
3  Accessing precise market data can sometimes be...
4  Thousands of Amazon workers nationwide organiz...
5
6
7
8
9

                                           Key_words
0                                                 []
1                                                 []
2                                                 []
3  [data, users, tailor, smartphone, switching, p...
4  [price, historic, warehouse, teamsters, worker...
5                                                 []
6                                                 []
7                                                 []
8                                                 []
9                                              [msn]
步骤 4:对 AMZN 进行股票情绪分析
#Sentiment Analysis
def percentage(part,whole):
    return 100 * float(part)/float(whole)

#Assigning Initial Values
positive = 0
negative = 0
neutral = 0
#Creating empty lists
news_list = []
neutral_list = []
negative_list = []
positive_list = []

#Iterating over the tweets in the dataframe
for news in news_df['Summary']:
    news_list.append(news)
    analyzer = SentimentIntensityAnalyzer().polarity_scores(news)
    neg = analyzer['neg']
    neu = analyzer['neu']
    pos = analyzer['pos']
    comp = analyzer['compound']

    if neg > pos:
        negative_list.append(news) #appending the news that satisfies this condition
        negative += 1 #increasing the count by 1
    elif pos > neg:
        positive_list.append(news) #appending the news that satisfies this condition
        positive += 1 #increasing the count by 1
    elif pos == neg:
        neutral_list.append(news) #appending the news that satisfies this condition
        neutral += 1 #increasing the count by 1

positive = percentage(positive, len(news_df)) #percentage is the function defined above
negative = percentage(negative, len(news_df))
neutral = percentage(neutral, len(news_df))

#Converting lists to pandas dataframe
news_list = pd.DataFrame(news_list)
neutral_list = pd.DataFrame(neutral_list)
negative_list = pd.DataFrame(negative_list)
positive_list = pd.DataFrame(positive_list)
#using len(length) function for counting
print("Positive Sentiment:", '%.2f' % len(positive_list), end='\n')
print("Neutral Sentiment:", '%.2f' % len(neutral_list), end='\n')
print("Negative Sentiment:", '%.2f' % len(negative_list), end='\n')

#Creating PieCart
labels = ['Positive ['+str(round(positive))+'%]' , 'Neutral ['+str(round(neutral))+'%]','Negative ['+str(round(negative))+'%]']
sizes = [positive, neutral, negative]
colors = ['yellowgreen', 'blue','red']
patches, texts = plt.pie(sizes,colors=colors, startangle=90)
plt.style.use('default')
plt.legend(labels)
plt.title("Sentiment Analysis Result for stock= "+company_name+"" )
plt.axis('equal')
plt.show()

# Word cloud visualization
def word_cloud(text):
    stopwords = set(STOPWORDS)
    allWords = ' '.join([nws for nws in text])
    wordCloud = WordCloud(background_color='black',width = 1600, height = 800,stopwords = stopwords,min_font_size = 20,max_font_size=150,colormap='prism').generate(allWords)
    fig, ax = plt.subplots(figsize=(20,10), facecolor='k')
    plt.imshow(wordCloud)
    ax.axis("off")
    fig.tight_layout(pad=0)
    plt.show()

print('Wordcloud for ' + company_name)
word_cloud(news_df['Summary'].values)


Positive Sentiment: 2.00
Neutral Sentiment: 8.00
Negative Sentiment: 0.00
AMZN 股票的情感分析结果如下图:

我们还可以输出 AMZN 的词库:

当我们完成了对某一种股票的情绪分析后,我们能不能进一步的去分析类似性质的一类股票呢?答案是可以的,让我们进入下一章节。
二、11 种科技股的每日平均矢量情绪得分
让我们对多只科技股的日平均情绪得分进行比较。
tickers = ['NVDA','TSLA','AMZN','BABA','META','MSFT','GOOG','AMD','IBM','NFLX','ORCL']2.1 导入程序库
import pandas as pd
from bs4 import BeautifulSoup
import matplotlib.pyplot as plt
from urllib.request import urlopen, Request
from urllib.error import HTTPError
from nltk.sentiment.vader import SentimentIntensityAnalyzer
import nltk
import time
import random
from datetime import datetime, timedelta

# Download the VADER lexicon
nltk.download('vader_lexicon')

True
2.2 获取相关信息
从 https://finviz.com 获取相关所需信息
# List of user agents to rotate
user_agents = [
    'Mozilla/5.0 (Windows NT 10.0; Win64; x64) AppleWebKit/537.36 (KHTML, like Gecko) Chrome/91.0.4472.124 Safari/537.36',
    'Mozilla/5.0 (Macintosh; Intel Mac OS X 10_15_7) AppleWebKit/605.1.15 (KHTML, like Gecko) Version/14.1.1 Safari/605.1.15',
    'Mozilla/5.0 (Windows NT 10.0; Win64; x64) AppleWebKit/537.36 (KHTML, like Gecko) Firefox/89.0'
]

# Function to parse date strings
def parse_date(date_str):
    if date_str == "Today":
        return datetime.now().date()
    elif date_str == "Yesterday":
        return datetime.now().date() - timedelta(1)
    else:
        return pd.to_datetime(date_str).date()

# Get Data
finwiz_url = 'https://finviz.com/quote.ashx?t='
news_tables = {}

for ticker in tickers:
    url = finwiz_url + ticker
    user_agent = random.choice(user_agents)
    req = Request(url=url, headers={'user-agent': user_agent})
    try:
        resp = urlopen(req)
        html = BeautifulSoup(resp, features="lxml")
        news_table = html.find(id='news-table')
        news_tables[ticker] = news_table
    except HTTPError as e:
        print(f"HTTPError for {ticker}: {e}")
    time.sleep(random.uniform(1, 3))  # Add delay

# Print Recent News Headlines
try:
    for ticker in tickers:
        df = news_tables[ticker]
        if df is None:
            print(f"No news for {ticker}")
            continue
        df_tr = df.findAll('tr')

        print('\n')
        print(f'Headers for {ticker}: ')

        for i, table_row in enumerate(df_tr):
            a_text = table_row.a.text
            td_text = table_row.td.text.strip()
            print(a_text, '(', td_text, ')')
            if i == n-1:
                break
except KeyError:
    pass

# Iterate through the news
parsed_news = []
for file_name, news_table in news_tables.items():
    if news_table is None:
        continue
    for x in news_table.findAll('tr'):
        text = x.a.get_text()
        date_scrape = x.td.text.split()

        if len(date_scrape) == 1:
            time = date_scrape[0]
            date = "Today"  # Assuming single time means today's news
        else:
            date = date_scrape[0]
            time = date_scrape[1]

        ticker = file_name
        parsed_news.append([ticker, date, time, text])

# Sentiment Analysis
analyzer = SentimentIntensityAnalyzer()

columns = ['Ticker', 'Date', 'Time', 'Headline']
news = pd.DataFrame(parsed_news, columns=columns)

Headers for NVDA:
Apple Just Exposed a Massive Risk for Nvidia Stock ( Today 06:15AM )

Headers for TSLA:
Like Tesla? You'll Love This AI Autonomy Stock ( Today 05:53AM )
1 Unfavorable Trend Explains Why Tesla Stock Is Trading 43% Below Its All-Time High ( 04:49AM )
.................
2.3 创建数据帧
创建带有平均情绪、neg、neu 和 pos 列的数据帧。
# Convert 'Date' column to actual dates
news['Date'] = news['Date'].apply(parse_date)

scores = news['Headline'].apply(analyzer.polarity_scores).tolist()
df_scores = pd.DataFrame(scores)
news = news.join(df_scores, rsuffix='_right')

# View Data
unique_ticker = news['Ticker'].unique().tolist()
news_dict = {name: news.loc[news['Ticker'] == name] for name in unique_ticker}

df.tail()

                     Avg Sentiment
Ticker
GOOG {'neg': 0.0, 'neu': 0.852, 'pos': 0.148, 'comp...
AMD {'neg': 0.0, 'neu': 0.625, 'pos': 0.375, 'comp...
IBM {'neg': 0.0, 'neu': 1.0, 'pos': 0.0, 'compound...
NFLX {'neg': 0.0, 'neu': 1.0, 'pos': 0.0, 'compound...
ORCL {'neg': 0.0, 'neu': 0.69, 'pos': 0.31, 'compou...


def extract_values(dictionary):
    age = dictionary['neg']
    gender = dictionary['neu']
    posval = dictionary['pos']
    return age, gender,posval

df[['neg', 'neu','pos']] = df['Avg Sentiment'].apply(lambda x: pd.Series(extract_values(x)))
print(df)

                           Avg Sentiment                   neg    neu    pos
Ticker
NVDA    {'neg': 0.362, 'neu': 0.638, 'pos': 0.0, 'comp...  0.362  0.638  0.000
TSLA    {'neg': 0.0, 'neu': 1.0, 'pos': 0.0, 'compound...  0.000  1.000  0.000
AMZN    {'neg': 0.0, 'neu': 1.0, 'pos': 0.0, 'compound...  0.000  1.000  0.000
BABA    {'neg': 0.0, 'neu': 0.769, 'pos': 0.231, 'comp...  0.000  0.769  0.231
META    {'neg': 0.174, 'neu': 0.682, 'pos': 0.144, 'co...  0.174  0.682  0.144
MSFT    {'neg': 0.0, 'neu': 0.909, 'pos': 0.091, 'comp...  0.000  0.909  0.091
GOOG    {'neg': 0.0, 'neu': 0.852, 'pos': 0.148, 'comp...  0.000  0.852  0.148
AMD     {'neg': 0.0, 'neu': 0.625, 'pos': 0.375, 'comp...  0.000  0.625  0.375
IBM     {'neg': 0.0, 'neu': 1.0, 'pos': 0.0, 'compound...  0.000  1.000  0.000
NFLX    {'neg': 0.0, 'neu': 1.0, 'pos': 0.0, 'compound...  0.000  1.000  0.000
ORCL    {'neg': 0.0, 'neu': 0.69, 'pos': 0.31, 'compou...  0.000  0.690  0.310
2.4 情绪比较
11 只科技股的负面情绪比较。
plt.bar(df.index,df['neg'])
plt.grid()
11 只科技股的积极情绪比较。
plt.bar(df.index,df['pos'])
plt.grid()
11 只科技股的中性情绪比较
plt.bar(df.index,df['neu'])
plt.grid()
11 种科技股的复合情绪比较
t=df['Avg Sentiment']
new_list = [i["compound"] for i in t]

print(new_list)

[-0.34, 0.0, 0.0, 0.5859, -0.1027, 0.0772, 0.3818, 0.765, 0.0, 0.0, 0.743]

plt.bar(df.index,new_list)
plt.grid()
通过上述情感分析,分析师可以解读新闻标题的情感基调。这一额外的信息层有助于更准确地预测市场趋势。
三、如何利用情绪分析做出明智的投资决策
在本节中,我们将学习如何在行业和产业的投资组合配置中使用经过解析和评分的财经新闻,一目了然。我们的目标是实现以下 NLP 情感分析工作流程 :
- 确定跨行业的多元化投资组合。
- 从 finviz.com 抓取并解析得分新闻标题。
- 比较负面、中性、正面和复合情绪的平均得分。
- 使用雅虎财经 API 阅读相关公司信息。
- 将投资组合中的股票总价值与股票情绪得分进行比较。
- 创建互动式股票情绪树状图。
- 利用新闻情绪评分,从风险/收益的角度优化我们的行业和产业投资组合配置。
步骤 1:导入 Python 库并初始化我们的投资组合
from urllib.request import urlopen, Request
from bs4 import BeautifulSoup
import yfinance as yf

# for plotting and data manipulation
import pandas as pd
import matplotlib.pyplot as plt
%matplotlib inline
import plotly
import plotly.express as px

# NLTK VADER for sentiment analysis
import nltk
nltk.downloader.download('vader_lexicon')
from nltk.sentiment.vader import SentimentIntensityAnalyzer

tickers_dict = {'AMZN': 5, 'TSLA': 1, 'GOOG': 3, 'META': 3, 'KO': 10, 'PEP': 5,  # amazon, tesla, google, meta, coke, pepsi
                'BA': 5, 'XOM': 5, 'CVX': 4, 'UNH': 1, 'JNJ': 3, 'JPM': 3, # boeing, exxon mobil, chevron, united health, johnson&johnson, jp morgan
                'BAC': 5, 'C': 5, 'SPG': 10, 'AAPL': 6, 'MSFT': 5, 'WMT': 6} # world fuel services, advanced micro devices, intuitive surgical, intel

tickers = tickers_dict.keys()
number_of_shares = tickers_dict.values()
步骤 2:获取和解析日期、时间和新闻标题数据,利用 Vader 进行情绪分析
##### Scrape the Date, Time and News Headlines Data
finwiz_url = 'https://finviz.com/quote.ashx?t='
news_tables = {}

for ticker in tickers:
    print(ticker)
    url = finwiz_url + ticker
    req = Request(url=url,headers={'User-Agent': 'Mozilla/5.0 (Windows NT 6.1; WOW64; rv:20.0) Gecko/20100101 Firefox/20.0'})
    response = urlopen(req)
    # Read the contents of the file into 'html'
    html = BeautifulSoup(response)
    # Find 'news-table' in the Soup and load it into 'news_table'
    news_table = html.find(id='news-table')
    # Add the table to our dictionary
    news_tables[ticker] = news_table


##### Parse the Date, Time and News Headlines into a Python List
parsed_news = []
# Iterate through the news
for file_name, news_table in news_tables.items():
    # Iterate through all tr tags in 'news_table'
    for x in news_table.findAll('tr'):
        # read the text from each tr tag into text
        # get text from a only
        text = x.a.get_text()
        # splite text in the td tag into a list
        date_scrape = x.td.text.split()
        # if the length of 'date_scrape' is 1, load 'time' as the only element
        if len(date_scrape) == 1:
            time = date_scrape[0]

        # else load 'date' as the 1st element and 'time' as the second
        else:
            date = date_scrape[0]
            time = date_scrape[1]
        # Extract the ticker from the file name, get the string up to the 1st '_'
        ticker = file_name.split('_')[0]

        # Append ticker, date, time and headline as a list to the 'parsed_news' list
        parsed_news.append([ticker, date, time, text])


##### Perform Sentiment Analysis with Vader
# Instantiate the sentiment intensity analyzer
vader = SentimentIntensityAnalyzer()
# Set column names
columns = ['ticker', 'date', 'time', 'headline']
# Convert the parsed_news list into a DataFrame called 'parsed_and_scored_news'
parsed_and_scored_news = pd.DataFrame(parsed_news, columns=columns)

# Iterate through the headlines and get the polarity scores using vader
scores = parsed_and_scored_news['headline'].apply(vader.polarity_scores).tolist()
# Convert the 'scores' list of dicts into a DataFrame
scores_df = pd.DataFrame(scores)

# Join the DataFrames of the news and the list of dicts
parsed_and_scored_news = parsed_and_scored_news.join(scores_df, rsuffix='_right')

AMZN
TSLA
GOOG
META
KO
PEP
BA
XOM
CVX
UNH
JNJ
JPM
BAC
C
SPG
AAPL
MSFT
WMT
步骤 3:平均情绪得分比较分析
检查数据帧 parsed_and_scored_news
parsed_and_scored_news.info()

<class 'pandas.core.frame.DataFrame'>
RangeIndex: 1800 entries, 0 to 1799
Data columns (total 8 columns):
 #   Column    Non-Null Count  Dtype
---  ------    --------------  -----
 0   ticker    1800 non-null   object
 1   date      1800 non-null   object
 2   time      1800 non-null   object
 3   headline  1800 non-null   object
 4   neg       1800 non-null   float64
 5   neu       1800 non-null   float64
 6   pos       1800 non-null   float64
 7   compound  1800 non-null   float64
dtypes: float64(4), object(4)
memory usage: 112.6+ KB

parsed_and_scored_news.tail()

   ticker date     time     headline                                         neg neu    pos compound
1795 WMT Dec-09-24 01:13PM Omnicom to Acquire Interpublic in Deal That Wi... 0.0 1.000 0.000 0.0000
1796 WMT Dec-09-24 11:28AM Walmart wraps up holiday promotion with omnich... 0.0 0.722 0.278 0.4019
1797 WMT Dec-09-24 10:48AM Muted growth expected in U.S. consumer spendin... 0.0 0.794 0.206 0.3818
1798 WMT Dec-09-24 10:42AM Here's Why $7 Goods Have Been Good Business fo... 0.0 0.775 0.225 0.4404
1799 WMT Dec-09-24 05:50AM Sams Club says customer input on private label... 0.0 1.000 0.000 0.0000
计算平均情感得分
# Group by each ticker and get the mean of all sentiment scores
mean_scores = parsed_and_scored_news.groupby(['ticker']).mean(numeric_only=True)
mean_scores

      neg     neu    pos    compound
ticker
AAPL 0.06559 0.82944 0.10495 0.073693
AMZN 0.08187 0.79159 0.12657 0.078206
BA   0.07512 0.87364 0.05122 -0.033472
BAC  0.05074 0.83878 0.11048 0.119623
C    0.05724 0.82534 0.11741 0.117026
CVX  0.04481 0.83620 0.11901 0.163593
GOOG 0.02228 0.85410 0.12364 0.178386
JNJ  0.03506 0.85808 0.10685 0.144027
JPM  0.03035 0.87529 0.09436 0.129621
KO   0.02631 0.84148 0.13222 0.201402
META 0.05247 0.82028 0.12726 0.145169
MSFT 0.03381 0.83642 0.12977 0.178756
PEP  0.06595 0.83772 0.09633 0.062241
SPG  0.02559 0.90227 0.07214 0.085266
TSLA 0.02877 0.88962 0.08162 0.110656
UNH  0.20654 0.73346 0.06002 -0.257733
WMT  0.04239 0.83688 0.12075 0.131448
XOM 0.04290 0.83830 0.11881 0.151074绘制负面情绪平均得分图
plt.figure(figsize=(12,6))
plt.bar(mean_scores.index,mean_scores['neg'])
plt.grid()
plt.title('Mean Negative Sentiment Score')
plt.show()
投资组合平均负面情绪得分如下图:

绘制积极情绪平均得分图
plt.figure(figsize=(12,6))
plt.bar(mean_scores.index,mean_scores['pos'])
plt.grid()
plt.title('Mean Positive Sentiment Score')
plt.show()
投资组合平均积极情绪得分如下图:

绘制中性情绪平均得分图
plt.figure(figsize=(12,6))
plt.bar(mean_scores.index,mean_scores['neu'])
plt.grid()
plt.title('Mean Neutral Sentiment Score')
plt.show()投资组合平均中性情绪得分如下图:

绘制平均复合情绪得分图
plt.figure(figsize=(12,6))
plt.bar(mean_scores.index,mean_scores['compound'])
plt.grid()
plt.title('Mean Compound Sentiment Score')
plt.show()投资组合平均复合情绪得分如下图:

我们观察到以下三点:(1) BA 和 UNH 的复合情绪得分异常消极;(2) 平均积极情绪得分较低;(3) 与其他资产相比,这两只股票的平均消极情绪得分较高。
步骤4:使用雅虎财经 API 阅读相关公司信息
让我们从雅虎财经 API 获取财务数据。我们可以通过它获取公司财务信息(如财务比率)和历史市场数据。
# get the price, sector and industry of each ticker using the yahoo finance api
# as an example this is the information that the api returns for TSLA
tickerdata = yf.Ticker('TSLA')
tickerdata.info

{'address1': '1 Tesla Road',
 'city': 'Austin',
 'state': 'TX',
 'zip': '78725',
 'country': 'United States',
 'phone': '512 516 8177',
 'website': 'https://www.tesla.com',
 'industry': 'Auto Manufacturers',
 'industryKey': 'auto-manufacturers',
 'industryDisp': 'Auto Manufacturers',
 'sector': 'Consumer Cyclical',
 'sectorKey': 'consumer-cyclical',
 'sectorDisp': 'Consumer Cyclical',
 'longBusinessSummary': 'Tesla, Inc. designs, develops, manufactures, leases, and sells electric vehicles, and energy generation and storage systems in the United States, China, and internationally. The company operates in two segments, Automotive, and Energy Generation and Storage. The Automotive segment offers electric vehicles, as well as sells automotive regulatory credits; and non-warranty after-sales vehicle, used vehicles, body shop and parts, supercharging, retail merchandise, and vehicle insurance services. This segment also provides sedans and sport utility vehicles through direct and used vehicle sales, a network of Tesla Superchargers, and in-app upgrades; purchase financing and leasing services; services for electric vehicles through its company-owned service locations and Tesla mobile service technicians; and vehicle limited warranties and extended service plans. The Energy Generation and Storage segment engages in the design, manufacture, installation, sale, and leasing of solar energy generation and energy storage products, and related services to residential, commercial, and industrial customers and utilities through its website, stores, and galleries, as well as through a network of channel partners; and provision of service and repairs to its energy product customers, including under warranty, as well as various financing options to its solar customers. The company was formerly known as Tesla Motors, Inc. and changed its name to Tesla, Inc. in February 2017. Tesla, Inc. was incorporated in 2003 and is headquartered in Austin, Texas.',
 'fullTimeEmployees': 140473,
 'companyOfficers': [{'maxAge': 1,
   'name': 'Mr. Elon R. Musk',
   'age': 51,
   'title': 'Co-Founder, Technoking of Tesla, CEO & Director',
   'yearBorn': 1972,
   'fiscalYear': 2023,
   'exercisedValue': 0,
   'unexercisedValue': 0},
  {'maxAge': 1,
   'name': 'Mr. Vaibhav  Taneja',
   'age': 45,
   'title': 'Chief Financial Officer',
   'yearBorn': 1978,
   'fiscalYear': 2023,
   'totalPay': 278000,
   'exercisedValue': 8517957,
   'unexercisedValue': 202075632},
  {'maxAge': 1,
   'name': 'Mr. Xiaotong  Zhu',
   'age': 43,
   'title': 'Senior Vice President of Automotive',
   'yearBorn': 1980,
   'fiscalYear': 2023,
   'totalPay': 926877,
   'exercisedValue': 0,
   'unexercisedValue': 344144320},
  {'maxAge': 1,
   'name': 'Travis  Axelrod',
   'title': 'Head of Investor Relations',
   'fiscalYear': 2023,
   'exercisedValue': 0,
   'unexercisedValue': 0},
  {'maxAge': 1,
   'name': 'Brian  Scelfo',
   'title': 'Senior Director of Corporate Development',
   'fiscalYear': 2023,
   'exercisedValue': 0,
   'unexercisedValue': 0},
  {'maxAge': 1,
   'name': 'Mr. Franz  von Holzhausen',
   'title': 'Chief Designer',
   'fiscalYear': 2023,
   'exercisedValue': 0,
   'unexercisedValue': 0},
  {'maxAge': 1,
   'name': 'Mr. John  Walker',
   'age': 60,
   'title': 'Vice President of Sales - North America',
   'yearBorn': 1963,
   'fiscalYear': 2023,
   'totalPay': 121550,
   'exercisedValue': 0,
   'unexercisedValue': 0},
  {'maxAge': 1,
   'name': 'Mr. Peter  Bannon',
   'title': 'Chip Architect',
   'fiscalYear': 2023,
   'exercisedValue': 0,
   'unexercisedValue': 0},
  {'maxAge': 1,
   'name': 'Mr. Turner  Caldwell',
   'title': 'Engineering Manager',
   'fiscalYear': 2023,
   'exercisedValue': 0,
   'unexercisedValue': 0},
  {'maxAge': 1,
   'name': 'Mr. Rodney D. Westmoreland Jr.',
   'title': 'Director of Construction Management',
   'fiscalYear': 2023,
   'exercisedValue': 0,
   'unexercisedValue': 0}],
 'auditRisk': 7,
 'boardRisk': 9,
 'compensationRisk': 10,
 'shareHolderRightsRisk': 9,
 'overallRisk': 10,
 'governanceEpochDate': 1733011200,
 'compensationAsOfEpochDate': 1703980800,
 'maxAge': 86400,
 'priceHint': 2,
 'previousClose': 479.86,
 'open': 466.36,
 'dayLow': 427.02,
 'dayHigh': 488.5399,
 'regularMarketPreviousClose': 479.86,
 'regularMarketOpen': 466.36,
 'regularMarketDayLow': 427.02,
 'regularMarketDayHigh': 488.5399,
 'beta': 2.295,
 'trailingPE': 120.58356,
 'forwardPE': 134.58151,
 'volume': 144545960,
 'regularMarketVolume': 144545960,
 'averageVolume': 90840046,
 'averageVolume10days': 93393990,
 'averageDailyVolume10Day': 93393990,
 'bid': 430.02,
 'ask': 441.62,
 'bidSize': 300,
 'askSize': 200,
 'marketCap': 1412843700224,
 'fiftyTwoWeekLow': 138.8,
 'fiftyTwoWeekHigh': 488.5399,
 'priceToSalesTrailing12Months': 14.54291,
 'fiftyDayAverage': 309.1128,
 'twoHundredDayAverage': 227.16154,
 'currency': 'USD',
 'enterpriseValue': 1392757571584,
 'profitMargins': 0.13075,
 'floatShares': 2793105010,
 'sharesOutstanding': 3210060032,
 'sharesShort': 77192871,
 'sharesShortPriorMonth': 77944508,
 'sharesShortPreviousMonthDate': 1730332800,
 'dateShortInterest': 1732838400,
 'sharesPercentSharesOut': 0.024,
 'heldPercentInsiders': 0.12911001,
 'heldPercentInstitutions': 0.47903,
 'shortRatio': 0.77,
 'shortPercentOfFloat': 0.0276,
 'impliedSharesOutstanding': 3210060032,
 'bookValue': 21.806,
 'priceToBook': 20.183895,
 'lastFiscalYearEnd': 1703980800,
 'nextFiscalYearEnd': 1735603200,
 'mostRecentQuarter': 1727654400,
 'earningsQuarterlyGrowth': 0.169,
 'netIncomeToCommon': 12743000064,
 'trailingEps': 3.65,
 'forwardEps': 3.24,
 'lastSplitFactor': '3:1',
 'lastSplitDate': 1661385600,
 'enterpriseToRevenue': 14.336,
 'enterpriseToEbitda': 105.161,
 '52WeekChange': 0.885501,
 'SandP52WeekChange': 0.2746848,
 'exchange': 'NMS',
 'quoteType': 'EQUITY',
 'symbol': 'TSLA',
 'underlyingSymbol': 'TSLA',
 'shortName': 'Tesla, Inc.',
 'longName': 'Tesla, Inc.',
 'firstTradeDateEpochUtc': 1277818200,
 'timeZoneFullName': 'America/New_York',
 'timeZoneShortName': 'EST',
 'uuid': 'ec367bc4-f92c-397c-ac81-bf7b43cffaf7',
 'messageBoardId': 'finmb_27444752',
 'gmtOffSetMilliseconds': -18000000,
 'currentPrice': 440.13,
 'targetHighPrice': 528.0,
 'targetLowPrice': 116.0,
 'targetMeanPrice': 278.18643,
 'targetMedianPrice': 272.485,
 'recommendationMean': 2.76596,
 'recommendationKey': 'hold',
 'numberOfAnalystOpinions': 42,
 'totalCash': 33648001024,
 'totalCashPerShare': 10.482,
 'ebitda': 13244000256,
 'totalDebt': 12782999552,
 'quickRatio': 1.214,
 'currentRatio': 1.844,
 'totalRevenue': 97150001152,
 'debtToEquity': 18.078,
 'revenuePerShare': 30.457,
 'returnOnAssets': 0.04759,
 'returnOnEquity': 0.20389,
 'freeCashflow': 676625024,
 'operatingCashflow': 14478999552,
 'earningsGrowth': 0.17,
 'revenueGrowth': 0.078,
 'grossMargins': 0.18229,
 'ebitdaMargins': 0.13633001,
 'operatingMargins': 0.107889995,
 'financialCurrency': 'USD',
 'trailingPegRatio': 12.203}
获取我们股票的开盘价、板块和行业
sectors = []
industries = []
prices = []
for ticker in tickers:
    print(ticker)
    tickerdata = yf.Ticker(ticker)
    prices.append(tickerdata.info['open'])
    sectors.append(tickerdata.info['sector'])
    industries.append(tickerdata.info['industry'])

AMZN
TSLA
GOOG
META
KO
PEP
BA
XOM
CVX
UNH
JNJ
JPM
BAC
C
SPG
AAPL
MSFT
WMT
步骤5:创建投资组合汇总表
# dictionary {'column name': list of values for column} to be converted to dataframe
d = {'Sector': sectors, 'Industry': industries, 'Price': prices, 'No. of Shares': number_of_shares}
# create dataframe from
df_info = pd.DataFrame(data=d, index = tickers)
df_info
计算投资组合中的股票总价值(美元)
df_info['Total Stock Value in Portfolio'] = df_info['Price']*df_info['No. of Shares']
df_info
将四个平均情感分数插入上述汇总表中
df = mean_scores.join(df_info)
df = df.rename(columns={"compound": "Sentiment Score", "neg": "Negative", "neu": "Neutral", "pos": "Positive"})
df = df.reset_index()
df
打印数据帧 df 的内容
df.info()

<class 'pandas.core.frame.DataFrame'>
RangeIndex: 18 entries, 0 to 17
Data columns (total 10 columns):
 #   Column                          Non-Null Count  Dtype
---  ------                          --------------  -----
 0   ticker                          18 non-null     object
 1   Negative                        18 non-null     float64
 2   Neutral                         18 non-null     float64
 3   Positive                        18 non-null     float64
 4   Sentiment Score                 18 non-null     float64
 5   Sector                          18 non-null     object
 6   Industry                        18 non-null     object
 7   Price                           18 non-null     float64
 8   No. of Shares                   18 non-null     int64
 9   Total Stock Value in Portfolio  18 non-null     float64
dtypes: float64(6), int64(1), object(3)
memory usage: 1.5+ KB
绘制投资组合中的股票总价值图
plt.figure(figsize=(12,6))
plt.bar(df['ticker'], df['Total Stock Value in Portfolio'])
plt.title('Total Stock Value in Portfolio')
plt.xlabel('Stock')
plt.ylabel('USD')
plt.grid()
plt.show()
我们可以将投资组合中的股票总价值与 4 个平均情绪得分进行比较(步骤 3)。
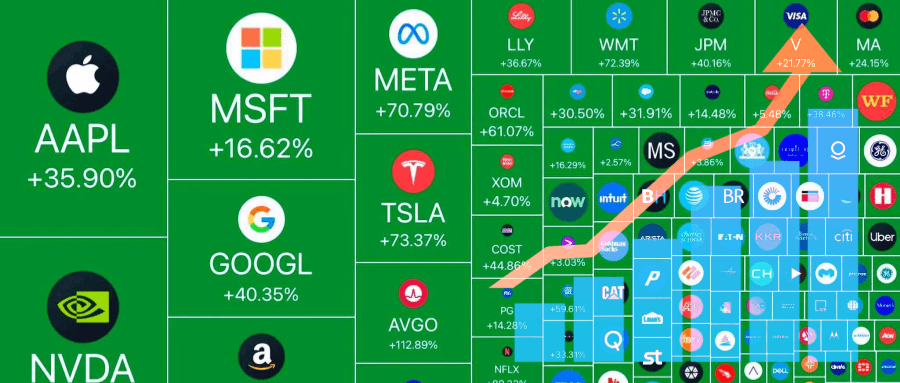
步骤 6:使用 Plotly 创建交互式股票情绪树状图
fig = px.treemap(df, path=[px.Constant("Sectors"), 'Sector', 'Industry', 'ticker'], values='Total Stock Value in Portfolio',
                  color='Sentiment Score', hover_data=['Price', 'Negative', 'Neutral', 'Positive', 'Sentiment Score'],
                  color_continuous_scale=['#FF0000', "#000000", '#00FF00'],
                  color_continuous_midpoint=0)

fig.data[0].customdata = df[['Price', 'Negative', 'Neutral', 'Positive', 'Sentiment Score']].round(3) # round to 3 decimal places
fig.data[0].texttemplate = "%{label}<br>%{customdata[4]}"

fig.update_traces(textposition="middle center")
fig.update_layout(margin = dict(t=30, l=10, r=10, b=10), font_size=20)

plotly.offline.plot(fig, filename='stock_sentiment.html') # this writes the plot into a html file and opens it
fig.show()
互动式股票情绪树状图 如上图。
第 7 步:利用新闻情绪评分(第 3-6 步),从风险/收益的角度优化行业和产业的投资组合配置。
我们可以调用 Backtrader 进行回溯测试,以进一步增强决策过程(步骤 7),如下所示的 SPY 数据示例 :
import backtrader as bt
import yfinance as yf
from datetime import datetime

class firstStrategy(bt.Strategy):
    def __init__(self):
        # initializing rsi, slow and fast sma
        self.rsi = bt.indicators.RSI(self.data.close, period=21)
        self.fast_sma = bt.indicators.SMA(self.data.close, period=50)
        self.slow_sma = bt.indicators.SMA(self.data.close, period=100)
        self.crossup = bt.ind.CrossUp(self.fast_sma, self.slow_sma)

    def next(self):
        if not self.position:
            # BUYING Condition
            if self.rsi > 30 and self.fast_sma > self.slow_sma:  # when rsi > 30 and fast_sma cuts slow_sma
                self.buy(size=100)  # buying 10 quantities of equity
        else:
            # SELLING Condition
            if self.rsi < 70:  # when rsi is below 70 line
                self.sell(size=100)  # selling 10 quantities of equity


# Variable for our starting cash
startcash = 1000000

# Create an instance of cerebro
cerebro = bt.Cerebro()

# Add our strategy
cerebro.addstrategy(firstStrategy)

import yfinance as yf
# 1.) Online data download
ticker='SPY'
start=datetime(2020,11,1)
end=datetime(2021,11,1)
data1 = bt.feeds.PandasData(dataname=yf.download(ticker, start=start, end=end))

cerebro.adddata(data1)

# setting broker commission to 0.2%
cerebro.broker.setcommission(commission=0.002)

# Set our desired cash start
cerebro.broker.setcash(startcash)

# Run over everything
result=cerebro.run()

# Get final portfolio Value
portvalue = cerebro.broker.getvalue()
pnl = portvalue - startcash

# Print out the final result
print('Final Portfolio Value: ${}'.format(portvalue))
print('P/L: ${}'.format(pnl))

Final Portfolio Value: $988687.5916992191
P/L: $-11312.408300780924
在下一篇中我将完成本文,其主要内容是 GRU 股票价格预测,以及使用 MLBC 进行市场情绪分析与进一步提升预测的准确性和及时性。
感谢您阅读到最后,希望本文能给您带来新的收获。码字不易,请帮我点赞、分享。祝您投资顺利!如果对文中的内容有任何疑问,请给我留言,必复。
本文内容仅限技术探讨和学习,不构成任何投资建议
Be First to Comment